


Carbon footprint of Dairy Farming
Shivani Singh, Aamir Raina, Argana A K, Anuj Chauhan, Ayon Tarafdar , Gyanendra Kumar Gaur
Livestock production management division ,Indian Veterinary Research Institute, Izatnagar,Bareily.
Abstract
Greenhouse gas (GHG) emissions and their potential effect on the environment has become an important global issue. Dairy production is a well recognized source of GHG emissions, but very limted is known about the net emissions from dairy enterprises. The main objective of this is to elucidate the carbon footprint of dairy farms and the potential sources leading to increased GHG emissions hence the carbon footprint. Various methods of estimating carbon footprint of dairy production has been focused .
Key words: Carbon footprint , LCA , GHGs sources, enteric methane, N2O ,carbon footprint estimation
Introduction
The increasing concentration of greenhouse gases in the atmosphere is leading to the phenomenon of climate change which is a major concern of the entire world today. Carbon dioxide (CO2), methane (CH4), and nitrous oxide (N2O) are the major greenhouse gases contributed by anthropogenic sources. It is the activity of incoming and outgoing GHGs which are leading to the warming and cooling of the surface of the earth respectively. Although increasing GHG production has been posing threat to life in the universe, their absence would bring down the average temperature of the earth’s surface to about -18°c (Qiancheng,1998).
Therefore, for the survival of life on earth, the heating effect is vital. However, it is the rapid increase in the concentration of these gases which are causing the impact of climate change and also global warming. Atmospheric methane (CH4) has been recognized as the second most important greenhouse gas after CO2, playing a significant role in global warming and climate change.
At present, the contribution of methane is about 20% in the anthropogenic radiative cause, only after carbon dioxide at 60% (Lassey, 2007). Methane is 25 times more potent in trapping atmospheric heating comparison to CO2 so acquired greater concern over these years. However, a comparatively low persistence period of about 10 years, compared to thousands of years in case of CO2 in the atmosphere, has led to increased global attention for implementing the emission reduction programs for methane.
According to the BUR (biennial update report) of India to the United Nations framework convention on climate change (UNFCCC) in 2010, the total emissions were reported as 19.8 (13.6–26.0) tg/yr and in this ruminants are contributing about 55%, followed by rice (17%), fossil fuel (13%) and waste (12%).
For quantifying the methane emissions from India between 2010 and 2015 and to investigate sources of discrepancies between the two inventories (Edgar and BUR,2010), used a combination of aircraft (passenger aircraft observations from caribic – civil aircraft for the regular investigation of the atmosphere based on an instrument container), satellite (GOSAT – greenhouse gases observing satellite) and surface observations and estimated the average emissions to be 22.0 (19.6–24.3) Tg/yr using the criteria of a high-resolution regional atmospheric transport model and a hierarchical Bayesian inverse modeling framework. Although these emissions data were similar to India’s reports to the UNFCCC but were about 30% lesser than the global methane inventory(Edgar, 2010).
The agriculture sector plays a very important role and in this too enteric fermentation, manure management, rice cultivation) accounts for 61% of the total methane emissions in India, with 40%contributed by enteric fermentation, 17% from rice cultivation, and 4% from manure management(Garg et al.,2011). The Process of fermentation occurs in the rumen, a large forestomach, which under anaerobic conditions produces methane as a by-product of the feed digestion system. (Broucek,2014). Methanogenesis, also known as biomethanation, is a microbial metabolic process of anaerobic respiration in which methane is produced with the reduction of carbon dioxide (CO2) by hydrogen (H2) with help of the methanogen microbes viz., bacteria, viruses, fungi, protozoa, and others. Estimation of methane emission by various studies indicates wide variations in the output by the Indian livestock, as most of these are based on theoretical calculations and without any systematic experiments (Singh et al., 1996).
In general, Cattle and Buffalo produce about 200-250 litres and sheep and goats produce about 30-40 liter of methane per day (Trivedi et al., 2020). Out of the total methane emission of 11.75 Tg/yr from the livestock, cattle and buffalo are the major contributors (10.9 Tg/yr) compared to 0.86 Tg/yr emission from other livestock.
Further, (Patra AK, 2014) estimated enteric methane emission of 14.3 tg/yr for the year 2010 and projected the same to be 15.8 tg/yr and 18.8 tg/yr by 2025 and 2050 respectively. According to his estimation, cattle holds the first position in contributing enteric methane emission of about half (49.1%) of total enteric methane, followed by buffalo (42.8%), goat (5.38%), sheep (2.59%), and others (0.73%). Using a dynamic approach based on the Stella software along with a developed mathematical model, (Dahiya et al.,2016) estimated methane emissions in India for a 25 year period (2007-2032) under six different scenarios following IPCC emission guidelines. Under modified scenarios, the results indicated the emissions range from 13.85 Tg/yr in 2007 to 16.62 Tg/yr in 2032. The highest emission was observed in Buffalo (1155 kg CO2e CH4/head/yr) followed by cattle (672 kg CO2e CH4/head/yr) and goats and sheep (105 kg CO2e CH4/head/yr) in all scenarios.
ICAR-NIANP has developed a state-wide inventory of enteric methane emissions from livestock in collaboration with several partner organizations of the country which is found to be 9.253 Tg (Bhatta et al.,2020). The study reflected that Uttar Pradesh (16.42%), Rajasthan (8,75%), Madhya Pradesh (8.54%), undivided Andhra Pradesh (7.87%), and Maharashtra (7.57%) are the major contributor of enteric methane emissions of the country.
Along with the major contribution of methane from enteric fermentation, the emission of methane also takes place through the reaction from manure heaps which is much lesser as compared to contribution from enteric fermentation. In the case of manures, the cellulose content of the manure is degraded by the microbes in the process of methanogenesis (Richard et al.,2009). Manure generated from livestock production systems is generally dumped as such at one place in solid form before being transferred to the agricultural land. Low digestibility of dietary nutrients may be subject to the generation of a higher amount of fermentable organic matter in the manure, which can lead to increased production of methane in the manure. Sometimes, the wastes are also subjected to composting before application in agricultural land or digested anaerobically to produce methane gas to be used as biofuel for cooking. Annual methane emissions from manure management from Indian livestock were estimated through several studies which came out to be 0.91 Tg/yr in 1997 (Swamy et al.,2006)] and 1.13 Tg/yr in 2010 (Patra et al., 2014).
Carbon foot print of dairy farming
Product carbon footprint is the total amount of GHG emissions associated with a product, along its supply-chain, including emissions from consumption, end-of-life recovery, and disposal(IPCC 4th Annual Report, 2007). It is usually expressed in kilograms or tonnes of carbon dioxide equivalent (CO2-eq).
CO2-equivalent emission – It is the amount of CO2 emissions that could cause the same time integrated Radiative forcing as an emitted amount of long-lived GHG or a mixture over a given time horizon.
The CO2 equivalent emission is obtained when GHG emission is multiplied by its global warming potential for the given time horizon. The CO2 equivalent emission is a standard and useful metric involved in the comparison of emissions of different GHGs but does not imply the same climate changes (IPCC, 4 AR 2007).
Global warming potential – It is an indicator that reflects the relative effect of a GHG in terms of climate change considering a fixed time period, such as 100 years, compared to the same mass of carbon. The most potent greenhouse gas is methane and 1kg methane corresponds to 25kg co2 eq with a half-life of 9.1 years (EPA,2020). The overall contribution of the global milk production, processing, and transportation to total anthropogenic emissions is estimated at 2.7 %.
Sources of GHG emissions
Greenhouse gases are emitted from two sources: primary sources and secondary sources. Net CO2 emissions along with all methane and N2O emissions during the feed production, animal maintenance, and handling of manure are included under primary sources.direct and indirect GHG emission sources are reflected in fig 1.
There are a number of sources that absorb CO2 from dairy farms and release it. One of the ways is carbon sequestration which is meant for the transfer and long-term storage of atmospheric CO2 into stable carbon pools that mean photosynthetically absorbed Carbon in .crop residues and manure is stored in soil organic matter(Bruce et al., 1999; Lal, 2008). An increase in C storage can result from changes that increase the amount of carbon entering the soil or reduce the rate of decomposition in the soil.
Primary sources of GHG emissions
Enteric fermentation produces the majority of methane followed by emissions from manure storage(EIA, 2006; Chianese et al., 2009). Ruminants produce CH4 via enteric fermentation which is released by eructation and respiration. The amount of CH4 produced depends upon factors like animal type and size, digestibility of the feed, Dry matter intake, total carbohydrates, and digestible carbohydrates (Wilkerson et al., 1995; Monteny et al., 2001). The model used to predict this emission and its sources are based on nutritional composition and management techniques that influence the animal’s intake and diet. Enteric emission is affected by metabolizable energy intake and the ratio of the starch to the ADF content of the diet which was calculated using the nonlinear model (Mills et al.,2003). On a daily basis, CH4 emission is predicted by taking 6 possible animal groups on a herd basis, based on their diet which is determined by hewrd component of the model (Rotz et al., 1999). The calorific value and fiber content of the diet, total DMI, and the amount of each feed ingredient utilized are all determined by this component. The model predicts an increased CH4 emission with high-fiber diets and decreased emission with high-starch diets. For calculating gaseous emissions from animal feeding operations NRC (2003) recommended a process-based modeling approach that included nutrient mass balance constraints and appropriate component emission factors.
A Carbon balance is calculated by taking into account all fluxes in and out of cropland throughout the production of the feeds for the herd. the net difference between the carbon fixed during crop growth and that emitted through the plant and soil respiration must match the Carbon removed in harvested feed minus that applied to the cropland in manure in order to enforce a long-term equilibrium. The amount of Carbon applied in manure is equal to the amount of C excreted by the animals plus the amount of C in any manure imported to the farm, minus all C lost during manure handling and the amount of C in manure exported from the production system.
So, the net exchange of C in feed production is:
Cnet = Cfeed − (Cexc − CCH4 − CCO2 − Cexp + Cimp)
where Cnet is the net C assimilated in feed production (kg); Cfeed is the C in feed and bedding material produced minus that in excess feed and bedding sold (kg); Cexc is the C in manure excreted by animals on the farm (kg); CCH4 is the C lost as CH4 from the barn floor, during storage, and following land application (kg); CCO2 is the C lost as CO2 from the barn floor and manure storage (kg); Cexp is the C in any manure exported from the production system (kg); and Cimp is the C in manure imported to the production system (kg).
The C content of feeds is determined by their carbohydrate, protein, and fat contents having a carbon content of about 40, 53, and 70%, respectively, based upon their chemical structures (Bailey and Ollis, 1986). Therefore, the C contents of forages and grains, high-protein concentrates, and added fat are about 40, 45, and 70%, respectively. Cnet, or the net flow of carbon in feed production, represents a net CO2 exchange with the environment. The molecular weight of CO2 to that of C (3.67 kg of CO2/kg of C) is used to convert this C exchange to CO2 units.
Low- and medium-productive animals are used in smallholder dairying in India and other developing nations, and the animals are fed mostly with crop leftovers and other agro-industrial by-products. The diets are nutritionally unbalanced, resulting in inefficient production and reproduction. This has a detrimental impact on emission intensity
According to Makkar (2013), most emerging countries have a scarcity of high-quality feed ingredients. In addition, in smallholder dairy production systems, feeding uneven rations is common. As a result, India’s average daily milk output of cows and buffaloes is extremely low, at 6.8 kg/crossbred cow (exotic), 2.5 kg/indigenous cow (zebu), and 4.9 kg/water buffalo (DAH, D&F 2014), potentially contributing to greater emission intensity
The Indian National Dairy Development Board (NDDB) has created a user-friendly ration-balancing (RB) software for preparing a low-cost balanced feed for dairy animals in the field. The NDDB created the RB program (RBP), a windows-based internet-connected application that compares an animal’s current nutritional condition to its nutrient requirements. With the available feed resources and a mineral mixture, both sets of data are used to find the least-cost ration. The software works on desktops, laptops, and netbooks, and it may also be used on personal digital assistants in regions where there is no internet access. A feed-data library and multiple ‘nutrition masters’ are included in the RBP. A wide range of feed materials, including green and dry forages, tree leaves, cereals, oil cakes, and agro-industrial by-products, were collected from various Agro-ecological zones around the country and chemically analyzed to produce the feed-data library. Simultaneously, existing national and international feeding guidelines for nutrient requirements of growing, lactating, and pregnant animals were used to produce a variety of nutritional requirements ‘nutrition masters’ (Kearl 1982; NRC 2001).
Following registration, the program tracked the animal’s daily feed consumption, including refusals, daily milk yield, milk fat level, body weight (BW), and pregnant status. On the basis of the data, the software determined the animals’ nutrient requirements. In addition, the nutrient quality of the feed supplied to animals was analyzed in terms of metabolizable energy (ME), crude protein (CP), and key minerals, in relation to the requirements, based on current feeding practices. The software produced a least-cost BR based on the chemical composition of available feed supplies, maximum quantity accessible for feeding, and nutritional limitations, which was delivered to milk producers in a local language. Extension personnel visited milk farmers on a regular basis or if the availability of feed materials changed. (Food and Agriculture Organization of the United Nations, 2012; Garg et al., 2013).
Feedipedia was used to determine the digestibility of various cereals, crop by-products, and residues for ruminants. When determining digestible allocation, the proportion of digestible dry matter (DM) of each feed item in the overall amount of digestible DM produced by the respective crop was taken into account. Only milk was considered as a system output in this analysis, hence all GHG emissions were attributed to milk, resulting in a 100 percent allocation to milk.
Then the second most important gas is N2O N2O is the second most significant gas. Denitrification and nitrification processes in the soil where crops are cultivated to feed the herd are the main sources of N2O. The crust on the surface of a slurry manure storage, stacked manure, bedded pack manure on barn floors, and manure-laden dry lot surfaces can all be affected by these processes. N2O-N emissions from cropland were considered to be 1% of applied nitrogen, while those from grazed pastureland were assumed to be 2% of applied nitrogen, according to IPCC (2006) recommendations. Because crop production is not mimicked, the amount of nitrogen applied is designed to be 40% more than the amount eliminated in harvested feed. This method presupposes that N fertilizer is used efficiently in the production of feed crops. The 40 percent overapplication allows for the natural loss of nitrogen in crop production that occurs when N is applied at the prescribed rate to achieve nutrient removal. The total N in the feed consumed by the herd is calculated as the sum of the DM for each feed consumed times the protein content divided by 6.25 to forecast N application. For each animal group, this N is raised by 40% and multiplied by the appropriate emission factor and an N to an N2O conversion factor of 1.57 EF (IPCC 2006).
Secondary sources
The manufacture of fuel, power, machinery, fertilizer, insecticide, and plastic used in the manufacturing of feeds, animal maintenance, and manure handling are all considered secondary sources in the model. All secondary emissions are measured in CO2e units per year. Emission factors are used to calculate emissions during the generation of fuel and power (Wang et al.,2007). These figures are 0.374 kg CO2e/L fuel and 0.73 kg CO2e/kWh electricity. As previously stated, fuel consumption is estimated. The total amount of electricity consumed for milking-related activities, lighting, and ventilation is referred to as “electricity usage.” It is estimated that 0.06 kWh/kg of milk produced is required for milking activities (Ludington and Johnson, 2003).
The C in gasoline is converted to CO2 and emitted in engine exhaust during the operation of tractors and other engine-powered equipment. The conversion factor for diesel fuel is 2.637 kg CO2/L. (Wang, 2007). Fuel use factors are used to estimate the amount of fuel consumed in the manufacturing system. These figures show the typical or average quantity of fuel used to make and supply a unit of feed to the herd, or to remove a unit of dung, respectively. The Integrated Farm System Model was used to calculate fuel utilization factors (Rotz et al.,2009).
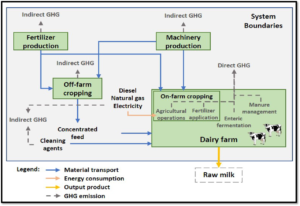
Fig 1: Direct and indirect sources of Greenhouse gas emissions.
Estimation of carbon footprint
Respiration calorimetry (closed or open-circuit), HDPE tunnel system, isotope dilution, tracer gas [i.e. sulfur hexafluoride (SF6)], and micrometeorological mass balance are the most popular in vivo measurement procedures (Kebreab et al., 2006). In commercial operations, new technologies are being developed to evaluate CH4 concentrations on an hourly basis utilizing rumen sensors (Laporte-Uribe and Gibbs, 2009) or by measuring CH4 eructated during feeding in robotic milking stations or at pasture feeders (Utsumi et al., 2011). Systematic discrepancies in measuring methodologies have been discovered (Kebreab et al., 2006; Muoz et al., 2012). In research settings that allow for animal confinement, respiration chambers remain the gold standard. Improvements to existing procedures or the development of new methodologies that allow groups to quantify CH4 emissions in a repeatable and accurate manner.
Estimation of carbon footprint is also done using a life cycle assessment system. The process used to calculate a product’s carbon footprint is called life cycle assessment (LCA). LCA study considers all inputs and outputs for a specific product and production system across a system boundary, such as a dairy farm, a dairy plant, or the full dairy production system. The research in Livestock’s Long Shadow (FAO, 2006a) was the first step in evaluating GHG emissions from the global livestock sector using a food-chain approach.
For all key primary and secondary GHG exchanges with the environment, a partial life cycle assessment (cradle to farm gate) is employed to combine the most appropriate published linkages and emission variables. The emissions emitted from the farm or production system during the actual production process are referred to as primary emissions. Secondary emissions are those that occur as a result of the manufacturing or production of resources employed in the manufacturing process. A Carbon footprint is calculated by adding up all annual emissions from both primary and secondary sources and dividing by annual ECM output.
The dairy farm is often represented by a dairy production system, but the system’s boundaries extend beyond the physical farm. All feed necessary to maintain the herd is produced as part of the production system. As a result, emissions from the production of all feed crops are included, regardless of whether the feeds are grown on the same farm as the animals or are acquired from a different farm. Unless a portion or all of the manure is labeled as exported from the production system, all manure nutrients are expected to be utilized in feed-crop production. This method allows for a comprehensive assessment of the entire milk production chain, which extends beyond specific farm limits. CO2, CH4, and N2O, which are all key greenhouse gases in dairy production, have varying potentials for trapping heat in the environment. The global warming potential equivalency index was created to standardize emissions (IPCC, 2001). Total GHG emissions in CO2 equivalent (CO2e) units are calculated in our model using global warming potential conversions of 25 kg of CO2e/kg of CH4 and 298 kg of CO2e/kg of N2O. (IPCC, 2007).
In agricultural and other industries, the life cycle assessment (LCA) method is commonly used to evaluate production’s environmental consequences and to identify resource and emission-intensive activities throughout a product’s life cycle. ISO standards 14040 and 14044 define the procedure (ISO, 2006). The ability of LCA to give a holistic assessment of production processes in terms of resource usage and environmental implications, as well as to incorporate various parameters, is one of its key features (ISO, 2006).
Many agri-food studies have utilized LCA to identify environmental hotspots and potential solutions to reduce environmental burden. (Roy and colleagues, 2009). The majority of the research was conducted at the farm level, excluding the last stages of product life (processing, transportation, disposal of packaging materials). Tamburini et al. (Tamburini et al., 2016). The functional units used to calculate GHG emissions in this study are kilograms of carbon dioxide equivalents (co2–eq.) per kilogram of FPCM and carcass weight at the farm gate. Using the following formula, all milk was transformed to FPCM with 4.0 percent fat and 3.3 percent protein:
Fpcm (kg) = raw milk (kg) * (0.337 + 0.116 * fat content (percentage) + 0.06 * protein content (percentage)
The steps involved in a life cycle analysis :
1.Creating a process map.
- Defining the scope and bounds of the project (scope definition)
- Data collection (inventory)
- Compilation (impact assessment)
- Reporting and evaluating (interpretation)
Mapping the process
The first step is to choose the project’s aim, followed by the functional unit that will be the focus of the analysis, and finally all materials, activities, and processes that contribute to the life cycle of the chosen product. It’s also crucial to choose between two different modeling approaches: attributional or consequential. It’s critical to establish all of these from the start to ensure that the goal is clear, that all components of the process are involved, and that the project does not grow or expand into areas that are unimportant.
Defining the scope and boundaries
The scope of the analysis is established in the second stage. The scope of the study should include the general approach used to define the system boundary, which defines which unit processes are included in the LCA, as well as the study’s aim.
Collecting the data
Data gathering and modeling of the product (e.g., milk, cheese) system, as well as data description and verification, are all part of this step. This includes all data about processes occurring within the study’s borders. The information must be associated with the functional unit.
Calculating the carbon footprint
The carbon footprint is calculated in the fourth phase utilizing all of the information acquired in the previous steps. The carbon footprint is calculated by converting all GHG emissions into CO2e figures and adding them together.
The GHG emissions for a functional unit are calculated using the following method:
- Multiply the activity data by the emission factor for the activity to convert primary and secondary data to GHG emissions. GHG emissions per functional unit of product are calculated in this way.
- The individual statistics are multiplied by the relevant global warming potential (GWP) factor to convert GHG emissions to CO2e emissions.
The sum of all materials, energy, and waste across all activities in a product’s life cycle, multiplied by their emission factors, is the equation for the carbon footprint of the product.
Because the GWP factors have changed over time when utilizing this methodology to calculate a product’s carbon footprint, the most recent IPCC GWP factors must be used.
1 kilogram of methane (CH4) equals 25 kilograms of CO2e 1 kilogram of nitrogen dioxide (N2O) equals 298 kilograms of carbon dioxide equivalent (CO2e).
Evaluating and reporting
The data should be presented appropriately and completely.
Mapping The procedure
- Creating a process
It is critical to be clear about the purpose of an LCA exercise from the start. Knowing the purpose – what is being assessed (the functional unit) and why, whom the results are meant for, and whether the results are to be used in public comparisons – aids in determining what is required to do the analysis.
- Defining the method
According to PAS 2050, the following steps should be followed to create a process map: Define the start and endpoints of the process being researched. Establish the functional unit. Make a list of all the steps in the procedure. Consider what you might have overlooked. Determine whether there are any co-products or by-products. List all inputs and their inputs from the beginning (for example, fertilizer used to grow feed for cow nutrition) to the end.
The functional unit for an on-farm study is one kilogram of fat- and protein-corrected milk (FPCM) at the farm gate in the nation where the analysis is being undertaken.
Using FPCM as the basis for farm comparisons ensures that farms with various breeds or feed regimens are compared fairly. FPCM is computed by multiplying milk output by the ratio of a farm’s (or region’s) milk’s energy content to the energy content of standard milk with 4% fat and 3.3 percent real protein content.
FPCM (kg/yr) = production (kg/yr) [0.1226fat% + 0.0776true protein% + 0] .2534]
If the standard milk requires a different composition, the energy equation can be used to compute the new standard milk energy, which can then be used to recalculate the FPCM equation’s coefficients. Lactose level in milk is generally stable at 4.85 percent.
Processing
The proposed functional unit at the processing gate is one kilogram of product with x percent fat and y percent protein, packaged at the dairy factory gate and ready for distribution in the nation where the analysis is taking place.
Reporting
The following ‘important parameters’ should be included in the report to gain a better knowledge of the researched systems.
Total carbon footprint, which is split into two categories: fossil and biogenic methane. Nitrous oxide, fossil carbon dioxide, biogenic carbon dioxide (biogenic carbon in packaging and land-use change carbon emissions should be stated separately) used as a functional unit, The percentage of emissions attributable to milk (i.e. the allocation factor between milk and meat/calves, as well as the method used to calculate the allocation factor), Dry matter intake per cow and body weight per animal class, Milk yield per cow and milk composition, Dry matter intake split by feed type [at a minimum, the proportion of roughage and concentrate feed (grain/protein)] a system for managing manure, In the dairy production facility for the analyzed product, all emission, and GWP variables were used, as well as their sources and the Allocation factors.
Standardization bodies
ISO (International organization for standardization)
It is in charge of the ISO 14040, 14044, and 14067 standards. These are the first standards for calculating a product’s carbon footprint.
IPCC (The Intergovernmental Panel on Climate Change )
It is the world’s main body for climate change assessment. UNEP and the World Meteorological Organization (WMO) founded it.
FAO ( Food and agriculture organization)
The methodology for assessing greenhouse gas emissions from the dairy sector is provided by the FAO. Recent studies by the United Nations Food and Agriculture Organization (FAO), such as Livestock’s Long Shadow, have highlighted the global livestock industry’s significant environmental effect (FAO, 2006a). When the full livestock commodity chain is considered – from land usage and feed production to animal farming and waste management, to product processing and transportation – the livestock sector accounts for roughly 18 percent of total anthropogenic GHG emissions.
Emissions are unlikely to decrease without concerted action. They are, on the contrary, increasing as worldwide demand for meat, milk, and eggs continue to rise. Total consumption is likely to rise as a result of projected population increase and rising affluence, with meat and milk consumption tripling by 2050 compared to 2000. (FAO, 2006).
Improving the dairy sector’s carbon footprint is a critical component of long-term milk production. To do so, policymakers, manufacturers, and consumers need accurate and objective data. While more information has been available in recent years, it is still fragmented and not based on a uniform or comparable set of procedures, according to a study of recent literature and databases. As a result, obtaining a clear, global picture from publicly available data is impossible.
The international dairy Federation (IDF), which represents the private dairy sector, has decided to support FAO’s environmental research to address this shortcoming and provide a system-wide assessment of the dairy sector’s GHG emissions as a critical first step in identifying mitigation opportunities.
Conclusion
In India’s agriculture sector, livestock is a major source of methane emissions. Enteric fermentation and manure management account for 91 percent and 9 percent of total methane emissions, respectively. When compared to other animals, cattle and buffalo are the biggest emitters of methane. In many countries, livestock methane emissions are a significant contributor to anthropogenic GHG emissions, and the focus is increasing to develop strategies to reduce these emissions. Currently,several techniques are being researched and developed. All techniques have distinct practicality, cost, and end-user adoption profiles. Although ruminant nutrition and feeding can have a significant impact on methane output. Manipulation of these animals’ diets to reduce absolute methane emissions is both a practical and costly challenge. On an experimental scale, attempts to limit CH4 synthesis by ruminants utilizing methanogenesis inhibitors such as PSM, antibiotics, and biotechnological approaches such as rumen defaunation generated interesting results. Furthermore, such efforts to reduce methane production should be tested using in vivo animal experiments to determine the best doses for inhibiting methane emission while having the least negative impact on ruminal fermentation of feed, so that they can be used in practice for cost-effective and environmentally friendly livestock production. Features like live weight gain, milk production, and feed efficiency, genetic variation is already being used to reduce the emissions intensity of ruminant operations indirectly.
References
Agrawal S, Joshi PK, Shukla Y, Roy PS (2003) SPOT-Vegetation multi temporal data for classifying vegetation in South Central Asia.
Bailey, J., and D. Ollis. 1986. Biochemical Engineering Fundamentals. 2nd ed. McGraw-Hill, New York, NY.
Bhatta R, Malik PK, Sejian V. Livestock production and climate change: methane and stress amelioration. In: Transfer of Mitigation Technologies for Heat Stress in Farm Animals. Proceedings of Indo-Australian Workshop on Transfer of Mitigation Technologies for Heat Stress in Farm Animals. Sejian V, Chauhan SS, Malik PK, Krishnan G, Bagath M, Kolte AP, Bhatta R (Eds). ICAR-NIANP, Bengaluru, India, 2020, 33-43.
Bruce, J. P., M. Frome, E. Haites, H. Janzen, R. Lal, and K. Paustian. 1999. Carbon sequestration in soils. J. Soil Water Conserv. 54:382–389.
Chianese DS, Rotz CA, Richard TL. Whole farm greenhouse gas emissions: A review with application to a Pennsylvania Dairy Farm. Applied Engineering in Agriculture. 2009; 25:431-442.
Chianese, D. S., C. A. Rotz, and T. L. Richard. 2009a. Wholefarm greenhouse gas emissions: A review with application to a Pennsylvania dairy farm. Appl. Eng. Agric. 25:431–442.
Climate Change 2007: The Physical Science basis, Summary for Policy Makers: Contribution of Working Group I to the Fourth Assessment Report of Intergovernmental Panel on Climate Change. http:// www.ipcc.ch Kumar S, Krishnan R, Nigam S (2008) Contribution of livestock in Indian scenario. Agric Situat (India) 2008:25–28.
Czerkawski, J. W. 1986. An Introduction to Rumen Studies. Pergamon Press, Oxford, UK.
DAH, D&F (2014) ‘Technical Committee of Direction (TCD) meeting (July 2014). Department of Animal Husbandry, Dairying & Fisheries,Ministry of Agriculture.’ (Government of India: Krishi Bhawan, New Delhi, India)
Environmental Protection Agency (EPA) (2006) Inventory of U.S. Greenhouse Gas Emissions and Sinks: 1990–2006.
EPA (Environmental Protection Agency). 2005. Opportunities to Reduce Anthropogenic Methane Emissions in the United States. Publication 430-R-93-012. EPA, Washington, DC.
FAO (2012)‘Balanced feeding for improving livestock productivity: increase in milk production and nutrient use efficiency and decrease in methane emission. Animal production and health paper no. 173 by MR Garg.’(FAO: Rome)
Feedipedia (2015) ‘Feedipedia: animal feed resources information system.’(INRA, CIRAD, AFZ and FAO) Available at http://www.feedipedia.org/[Verified 7 September 2015].
Garg A, Kankal B, Shukla PR. Methane emissions in India: sub-regional and sectoral trends. Atmospheric Environment. 2011; 45:4922-4929. 10. Broucek J. Production of methane emissions from ruminant husbandry: A review. Journal of Environment Protection. 2014; 5:1482-1493.
Garg MR, Sherasia PL, Bhanderi BM, Phondba BT, Shelke SK, Makkar HPS (2013) Effect of feeding nutritionally balanced rations on animal productivity, feed conversion efficiency, feed nitrogen use efficiency, rumen microbial protein supply, parasitic load, immunity and enteric methane emissions of milking animals under field conditions. Animal Feed Science and Technology .
IPCC (1996) Revised 1996 IPCC Guidelines for National Greenhouse gas Inventories. In: Houghton JT, Meira Filho LG, Lim B, Treanton K, Mamaty I, Bonduki Y, Griggs DJ, Callender BA (eds). IPCC/OECD/ IEA, UK Meteorological Office, Bracknell
IPCC (2001) Climate Change 2001: The Scientific Basis. Intergovernmental Panel on Climate Change and UN Environmental Programme, Cambridge University Press, http://www.ipcc.ch.
IPCC (2006)‘Guidelines for national greenhouse gas inventories, prepared bythe national greenhouse gas inventories programme.’ (Eds HS Eggleston,L Buendia, K Miwa, T Ngara, K Tanabe) (IGES: Kanagawa, Japan)Available at http://www.ipcc-nggip.iges.or.jp/public/2006gl/index.htm[Verified 17 November 2015]
IPCC (2007) Climate Change 2007. The physical science basis. In‘Contribution of Working Group I to the fourth assessment report of the Intergovernmental Panel on Climate Change’. (Eds S Solomon, D Qin,M Manning, Z Chen, M Marquis, KB Averyt, M Tignor, HL Miller) pp. 20–91. (Cambridge University Press: Cambridge, UK).
IPCC. 2001. Climate Change 2001: The Scientific Basis. Contribution of Working Group I to the Third Assessment Report of the Intergovernmental Panel on Climate Change. Cambridge University Press, Cambridge, UK.
ISO 14040 (2006) ‘Environmental management, life cycle assessment: principles and framework. Standard 14040.’ (International Organizationfor Standardization: Geneva, Switzerland).
ISO 14044 (2006) ‘Environmental management, life cycle assessment: requirements and guidelines. Standard 14044.’ (InternationalOrganization for Standardization: Geneva, Switzerland).
Kearl LC (1982) ‘Nutrient requirements of ruminants in developing countries.’ (International Feedstuffs Institute, Utah Agricultural Experiment Station, Utah State University: Logan, UT
Kitzes, J., M. Wackernagel, J. Loh, A. Peller, S. Goldfinger, D. Cheng, and K. Tea. 2008. Shrink and share: Humanity’s present and future ecological footprint. Phil. Trans. Biol. Sci. 363:467–475.
Lal, R. 2008. Carbon sequestration. Phil. Trans. Biol. Sci. 363:815–830.
Lassey KR. Livestock methane emission: from the individual grazing animal through national inventories to the global methane cycle. Agricultural and Forest Meteorology. 2007; 142(2):120-132.
Ludington, D., and E. L. Johnson. 2003. Dairy Farm Energy Audit Summary. FlexTech Services, New York State Energy Research and Development Authority, Albany, NY. http://www.nyserda.org/publications/dairyfarmenergysummary.pdf Accessed May 18, 2009.
Makkar HPS (2013) Towards sustainable animal diets. Optimization of feed use efficiency in ruminant production systems. In ‘Proceedings of the FAO symposium, 27 November 2012, Bangkok, Thailand. FAO animal production and health proceedings, no. 16’. (Eds HPS Makkar, D Beever),pp. 67–74. (FAO and Asian–Australasian Association of Animal Production Societies: Rome).
Mills, J. A. N., E. Kebreab, C. M. Yates, L. A. Crompton, S. B. Cammell, M. S. Dhanoa, R. E. Agnew, and J. France. 2003. Alternative approaches to predicting methane emissions from dairy cows. J. Anim. Sci. 81:3141–3150.
Moe, P. W., and H. F. Tyrrell. 1979. Methane production in dairy cows. J. Dairy Sci. 62:1583–1586.
Monteny, G. J., C. M. Groenestein, and M. A. Hilhorst. 2001. Interactions and coupling between emissions of methane and nitrous oxide from animal husbandry. Nutr. Cycl. Agroecosyst. 60:123–132
NRC. 2003. Air Emissions from Animal Feeding Operations: Current Knowledge, Future Needs. Natl. Acad. Sci., Washington, DC.
Qiancheng MA. Greenhouse gases: refining the role of carbon dioxide. Science Briefs, The National Aeronautics and Space Administration (NASA), Goddard Institute of Space Studies, 1998. https://www.giss.nasa.gov/research/briefs/ma_01/ .
Rauw, W. M., E. Kanis, E. N. Noordhuizen-Stassen, and F. J. Grommers. 1998. Undesirable side effects of selection for high production efficiency in farm animals: A review. Livest. Prod. Sci. 56:15–33.
Rhoads, M. L., R. P. Rhoads, M. J. VanBaale, R. J. Collier, S. R. Sanders, W. J. Weber, B. A. Crooker, and L. H. Baumgard. 2009. Effects of heat stress and plane of nutrition on lactating Holstein cows: I. Production, metabolism, and aspects of circulating somatotropin. J. Dairy Sci. 92:1986–1997.
Rotz, C. A. 2004. Management to reduce nitrogen losses in animal production. J. Anim. Sci. 82(E-Suppl.):E119–E137.
Rotz, C. A., M. S. Corson, D. S. Chianese, and C. U. Coiner. 2009. Integrated Farm System Model: Reference Manual. Pasture Systems and Watershed Management Research Unit, USDA Agricultural Research Service, University Park, PA. http://ars.usda.gov/ SP2UserFiles/Place/19020000/ifsmreference.pdf Accessed August 31, 2
Singh GP, Mohini M. Methane emission by Indian ruminant livestock, Current Science. 1996; 71(7):580582.
Swamy M, Bhattacharya S. Budgeting anthropogenic Journal of Entomology and Zoology Studies http://www.entomoljournal.com greenhouse gas emission from Indian livestock using country-specific emission coefficients. Current Science. 2006; 91:1340-1353.
Trivedi S, Malik PK, Kolte AP, Thirumalaisamy G, Sejian V, Bhatta R. Relevance of unrevealing methanogen diversity to reduce methane emission from Indian livestock. In: Transfer of Mitigation Technologies for Heat Stress in Farm Animals. Sejian V, Chauhan SS, Malik PK, Krishnan G, Bagath M, Kolte AP, Bhatta R (Eds). Proceedings of Indo-Australian Workshop on Transfer of Mitigation Technologies for Heat Stress in Farm Animals. ICAR-NIANP, Bengaluru, India, 2020, 143-146.
Uribe, H. A., B. W. Kennedy, S. W. Martin, and D. F. Kelton. 1995. Genetic parameters for common health disorders of Holstein cows. J. Dairy Sci. 78:421–430.
Wang, M. 2007. GREET. Version 1.8a. Argonne National Laboratory, Argonne, IL. http://www.transportation.anl.gov/software/ GREET/ Accessed January, 2008.
Wilkerson, V. A., D. P. Casper, and D. R. Mertens. 1995. The prediction of methane production of Holstein cows by several equations. J. Dairy Sci. 78:2402–2414.
Zwald, N. R., K. A. Weigel, Y. M. Chang, R. D. Welper, and J. S. Clay. 2004. Genetic selection for health traits using producerrecorded data.
https://www.fao.org/climatechange/41535-017ba85988db8b506df8bb1c07443208e.pdf